Measuring Pipeline Latency
Incremental View Maintenance (IVM) enables Feldera to quickly incorporate changes to input data into analytical queries. In practice it is often important to know exactly how much processing delay a Feldera pipeline introduces to your application. This article covers the key latency metrics Feldera exposes, and explain how they can help you measure and understand the end-to-end processing latency of your pipelines.
Background: Understanding pipeline latency
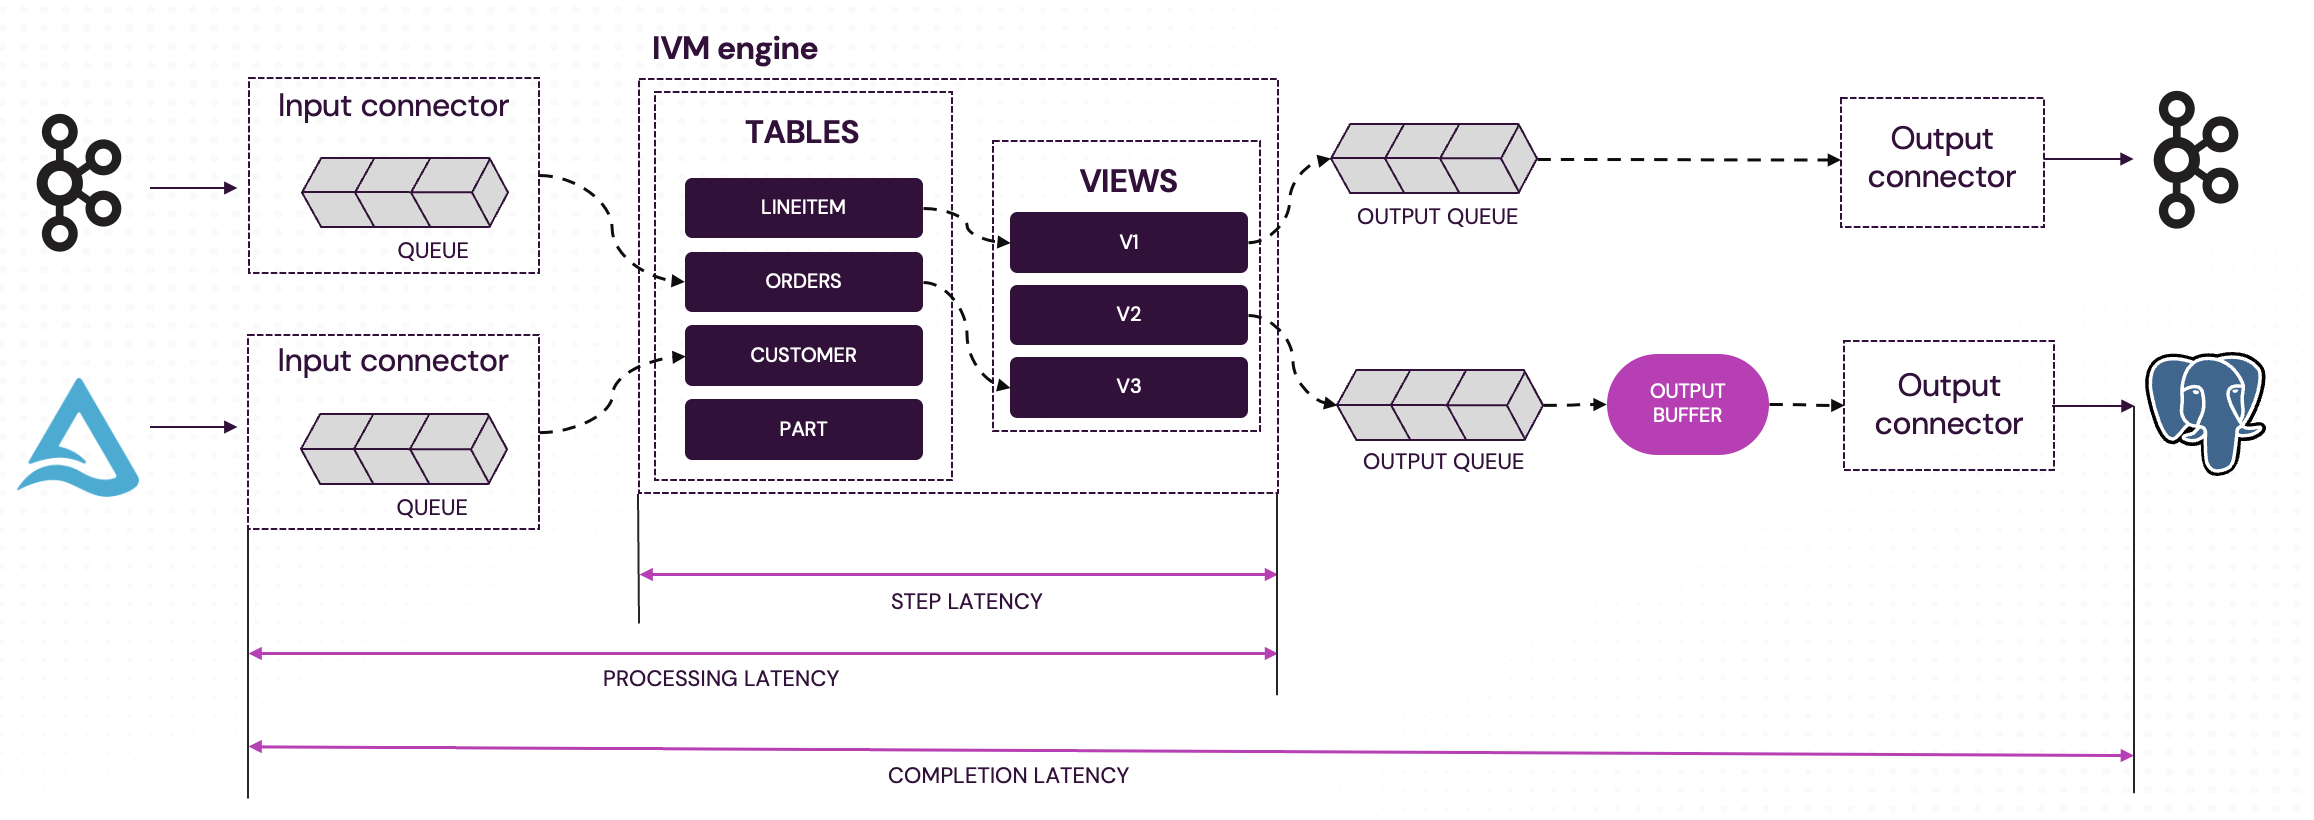
A Feldera pipeline processes data in several stages:
- Input connectors read data from the data source (e.g., a database table or a Kafka stream) and parse it into a stream of data change events (inserts, deletes, and updates to SQL tables). The connector buffers incoming data in its input queue until the IVM engine is ready to process it. If the pipeline keeps up with data arrival, input queues stay nearly empty. When data arrives faster than the engine can process it, the queue fills up, leading to higher latency.
- IVM engine repeatedly dequeues batches of changes from input queues and computes updates to all affected output views.
- Output queues buffer outputs produced by the engine until output connectors process them. If an output connector keeps up with changes, its queue is nearly empty. Otherwise, changes accumulate in the queue, leading to higher end-to-end latencies.
- Output buffers can be optionally configured for output connectors to batch multiple updates before sending them to the connector. They increase the end-to-end latency by delaying outputs up to a user-configurable bound.
- Output connectors serialize output updates and send them to target data sinks.
Latency metrics
A pipeline exposes key latency metrics through its /metrics
endpoint. See complete list of metrics here.
Completion latency (input_connector_completion_latency_seconds)
Scope: Per input connector
Definition: End-to-end latency, from ingestion of a batch by the input connector until all resulting outputs have been sent to all sinks.
Reported as: Histogram over the last 600 seconds or 10,000 batches (whichever is smaller).
Note that the granularity of a batch is determined by the input connector, e.g., a Kafka connector can read and enqueue multiple messages at a time. The Delta Lake connector
Processing latency (input_connector_processing_latency_seconds)
Scope: Per input connector
Definition: Latency from ingestion of a batch until the IVM engine has computed all updates (before they are delivered to sinks).
Reported as: Histogram over the last 600 seconds or 10,000 batches (whichever is smaller).
Step latency (dbsp_step_latency_seconds)
Scope: Pipeline-wide
Definition: Time the IVM engine takes to complete a single processing step.
Reported as: Histogram over the last 60 seconds or 1,000 steps (whichever is smaller).
Measuring end-to-end latency with input frontiers
The metrics above capture internal pipeline delays only. They exclude the time between when data is written to the source and when it is picked up by Feldera, e.g., the time between a new message was written Kafka until it was dequeued by the pipeline. Accounting for this latency is essential to measuring the pipeline's contribution to the end-to-end processing latency of your application.
While this latency is not measured by the pipeline itself, the pipeline exposes
metadata that helps the user to measure this latency. This per-connector metadata is only
available for certain connector types,
via the /stats
endpoint in the .inputs[<connector_index>].completed_frontier field.
It describes the latest offset in the input data stream fully processed by the pipeline.
It includes the following fields:
| Field | Description | Format |
|---|---|---|
metadata | Connector-specific metadata that describes the latest offset in the input stream fully processed by the pipeline (e.g., Kafka partition/offset pairs). | connector-specific (see below) |
ingested_at | Timestamp when data was ingested from the wire. | RFC 3339 timestamp |
processed_at | Timestamp when the IVM engine finished processing it. | RFC 3339 timestamp |
completed_at | Timestamp when all resulting outputs were delivered to all sinks. | RFC 3339 timestamp |
The completed_frontier property is currently supported for the following connectors:
These connectors support the following metadata formats:
- Delta Lake
- Kafka
{
    "version": N
}
where version is the latest Delta table version processed by the pipeline.
{
    "offsets": [
    {
        "start": START_OFFSET1,
        "end": END_OFFSET1
    },
    {
        "start": START_OFFSET2,
        "end": END_OFFSET2,
    },
    ...
    ]
}
where the offsets array stores the offset range in the last processed batch per Kafka partition.
Example
Consider a Delta Lake connector that reports the following completed frontier:
{
    "metadata": {
        "version":10
    },
    "ingested_at":"2025-09-20T22:32:32.916501+00:00",
    "processed_at":"2025-09-20T22:33:34.112410+00:00",
    "completed_at":"2025-09-20T22:33:34.112414+00:00"
}
When this data is reported, this means that the pipeline has fully processed all Delta table versions up to version 10. To determine how far behind the current state of the Delta table the pipeline lags, we have to go outside of Feldera to query the timestamp of the the first Delta table version after version 10 (if any). For example, using Spark SQL:
WITH history AS (
  DESCRIBE HISTORY my_table
)
SELECT
  CASE WHEN version = 11 THEN timestamp END AS v11_timestamp,
  (unix_timestamp(now()) - unix_timestamp(v11_timestamp)) AS seconds_between
FROM history;
which produces output similar to this:
+-----------------------+----------------+
| v11_timestamp         | seconds_between|
+-----------------------+----------------+
| 2025-09-20 22:31:15   |             5  |
+-----------------------+----------------+
This means that the outputs written by the pipeline to its data sinks reflect the contents of the Delta table as of 5 seconds ago.